Neighborhood Scorecard
Source: · HUD FMR FY2024 · FBI UCR (latest county year) · DOL NDCP
93410 – San Luis Obispo, CA
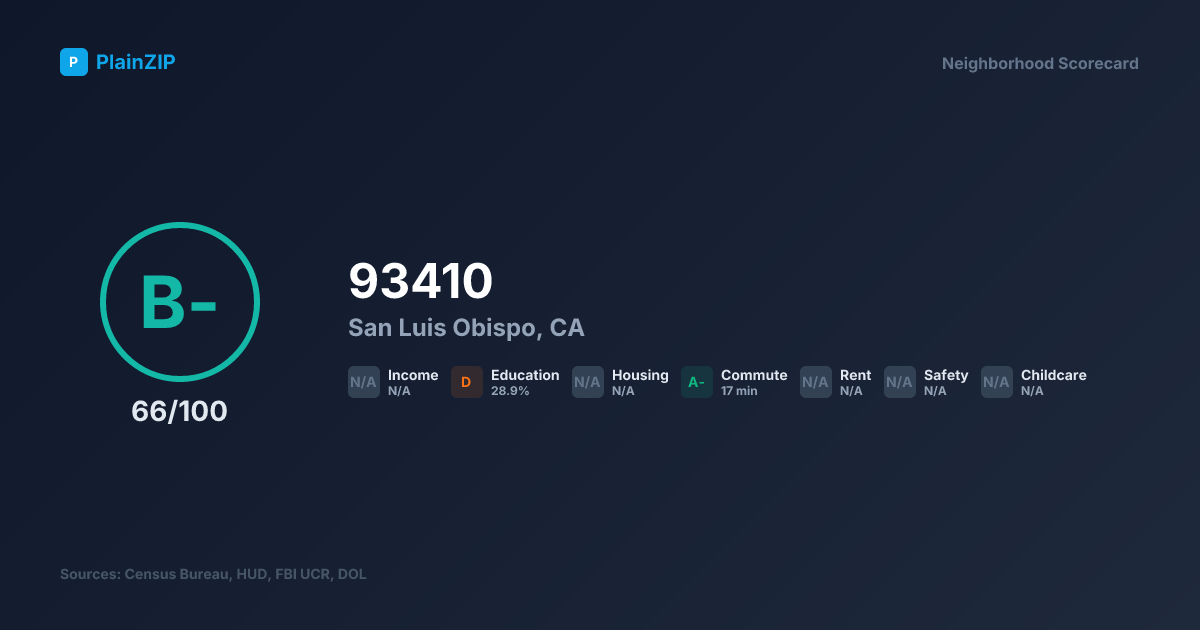
The neighborhood scorecard for ZIP 93410 in San Luis Obispo, CA blends seven federal datasets into a single letter grade of B- (66/100). The underlying inputs pulled for this ZIP include a median household income of -, a median home value of -, 28.9% of adults with a bachelor's degree or higher, and an average commute of 17 minutes. Every value comes directly from Census ACS 5-Year Estimates tied to ZIP 93410, not a national average mapped onto the ZIP.
Cross-agency inputs extend the score beyond Census demographics. Department of Labor county childcare data lists infant center-based care at $18,786 per year, which the scorecard weighs against local median income to form the childcare grade. If any of these feeds is missing for 93410, the scorecard transparently drops that dimension rather than inventing a score.
Reading the grade means reading the dimensions together. The overall B- score for 93410 reflects a weighted blend, Income (20%), Safety (20%), Housing (15%), Rent (15%), Education (10%), Commute (10%), and Childcare (10%) - and each dimension is benchmarked against national percentiles rather than in-state-only comparisons. Strengths visible in the raw data include commute. Areas pulling the overall grade down are education. The 5 nearby ZIP codes listed below provide immediate geographic context, two adjacent ZIPs can land several grade letters apart due to school-district boundaries, zoning, and commute arteries.
Based on income, housing cost, safety, education, commute, and childcare-cost data from federal sources, not school test scores, walkability, weather, culture, or day-to-day livability.
Score Breakdown
Income
N/AMedian household income
Education
DBachelor's degree or higher
Housing
N/AHome value to income ratio
Commute
A-Average commute time
Rent
N/A2-bedroom fair market rent (county)
Safety
N/AViolent crime rate (county)
Childcare
N/ACenter-based infant care cost (county)
Share Your Neighborhood Score
Download or share this scorecard with friends, family, or on social media.
What This Means
San Luis Obispo, CA (93410) receives an overall grade of B- based on publicly available data from the Census Bureau, HUD, FBI, and Department of Labor. This area performs well in commute. Data was unavailable for income, housing, rent, safety, childcare – these dimensions were excluded from the overall score.
Nearby ZIP Scorecards
Side-by-side: Compare 93410 vs 93405 →
Frequently Asked Questions
What is the overall score for ZIP 93410?▼
Is 93410 a good place to live?▼
How is the neighborhood scorecard calculated?▼
Official Data Resources
Vintages stay separate: ACS demographics/housing 2019–2023; HUD FMR FY2024; FBI UCR and DOL NDCP use each feed's latest county year. Rent and childcare grades are exploratory joins of those feeds against ACS median income, not a claim that every agency shares one fiscal year. Source: U.S. Census Bureau ACS 5-Year Estimates. Source: HUD Fair Market Rents. Source: FBI Uniform Crime Report. Source: DOL NDCP childcare prices. Verify with HUD →
Read our methodology to see how this data is sourced, computed, and verified.